
Language
A chamber display tells you what one sensor sees at one place. That is not the same as knowing how tightly the chamber holds a set point, how evenly temperature spreads across the working volume, or whether a ramp actually follows the profile the test method assumes. Verifying those three things is what turns a set point into a condition you can defend.
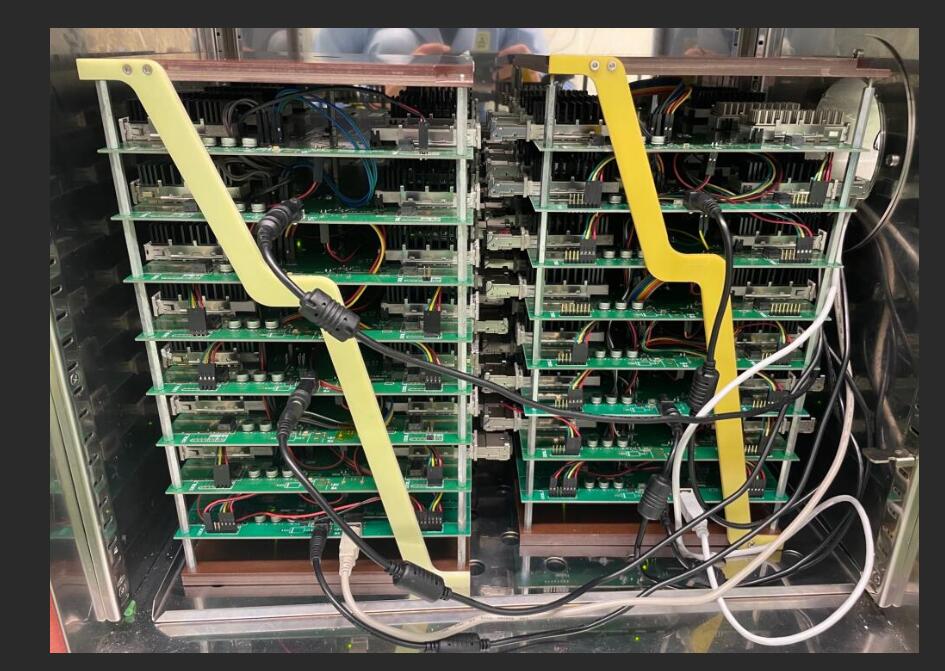
IEC 60068-3-5 is the usual starting point for this kind of confirmation. Even labs that follow their own internal procedure tend to borrow its structure, because the parameters are easier to compare when everyone measures them the same way. What follows walks through the order in which the checks usually happen: the chamber has to stabilise first, then fluctuation and spatial variation can be measured, and finally the dynamic behaviour during heating and cooling can be looked at.
Every steady-state number depends on the chamber actually being stable. A display that stops changing is not proof of that. Under JJF 1101-2019, recording can begin 30 minutes after the set value is reached, but if the readings are still drifting, the wait can be extended by up to another 30 minutes, capped at 60 minutes total. The judgement of "stable" is part of the measurement, not a formality before it starts.
There is also a question to settle before the run begins: is the chamber empty or loaded? An empty run characterises the equipment. A loaded run is closer to real use, but it brings in specimen mass, surface area, placement and possible internal heat generation. Where a load is used, one documented approach fills at least 40% of the useful volume unless the customer specifies otherwise. Whichever route you take, say so in the report. A uniformity figure measured without load does not automatically carry over to a dense or thermally heavy load.
Fluctuation is about time, not space. It describes how much a single measurement point moves once the chamber has settled, and it is not the same as any offset between the indicated temperature and a reference.
The arithmetic is usually half the maximum range seen at a measuring point over the recording window, quoted with a ± sign. Binder's factory documentation, which follows DIN 12880, defines it as half the maximum variance of the central measuring point around its mean. JJF 1101-2019 does something related but not identical: for each point, take half the difference between the highest and lowest readings over 30 minutes, then report the largest of those half-ranges across all points. One convention is centred on the middle sensor, the other on the worst-case sensor. They can give different numbers, so the report should say which one was used.
Sampling interval matters too. JJF 1101-2019 calls for readings every 2 minutes over 30 minutes, which gives 16 data sets, though the interval and count can be adjusted if that is documented. Shorter intervals catch more short-term wobble; longer ones smooth it out. Either is defensible, as long as the interval is stated next to the result.
Uniformity is the spatial counterpart. It asks how much temperature differs across the usable volume at a given moment, which means it cannot be answered from a single sensor.
The sensor layout is not a free choice. For chambers up to 2,000 litres, a nine-point arrangement is common: eight corners of the working-space box plus the centre. Above 2,000 litres, the count rises to fifteen. JJF 1101-2019 allows the number and positions to be adapted to the user's actual working needs, provided the arrangement is written down. The point of writing it down is repetition. A later verification that uses a different layout is not really comparable to the first one.
There is more than one way to turn the sensor data into a uniformity figure, and the choice changes the answer. JJF 1101-2019 takes, at each sampling instant, the difference between the highest and lowest readings across all points, then averages those differences over the recording period. Binder's documentation takes a different route: find the point whose mean value deviates most from the overall mean, then take half the difference between that point's mean and the mean of the point deviating in the opposite direction. These are not interchangeable. Pick the one your governing specification calls for, or state clearly which one you used so that results from different campaigns can be lined up against each other.
Ramp rate verification asks whether the chamber actually moves between temperatures at the claimed speed, and whether the movement is reasonably consistent along the way. It is a dynamic measurement, and it is more sensitive to method than the steady-state checks.
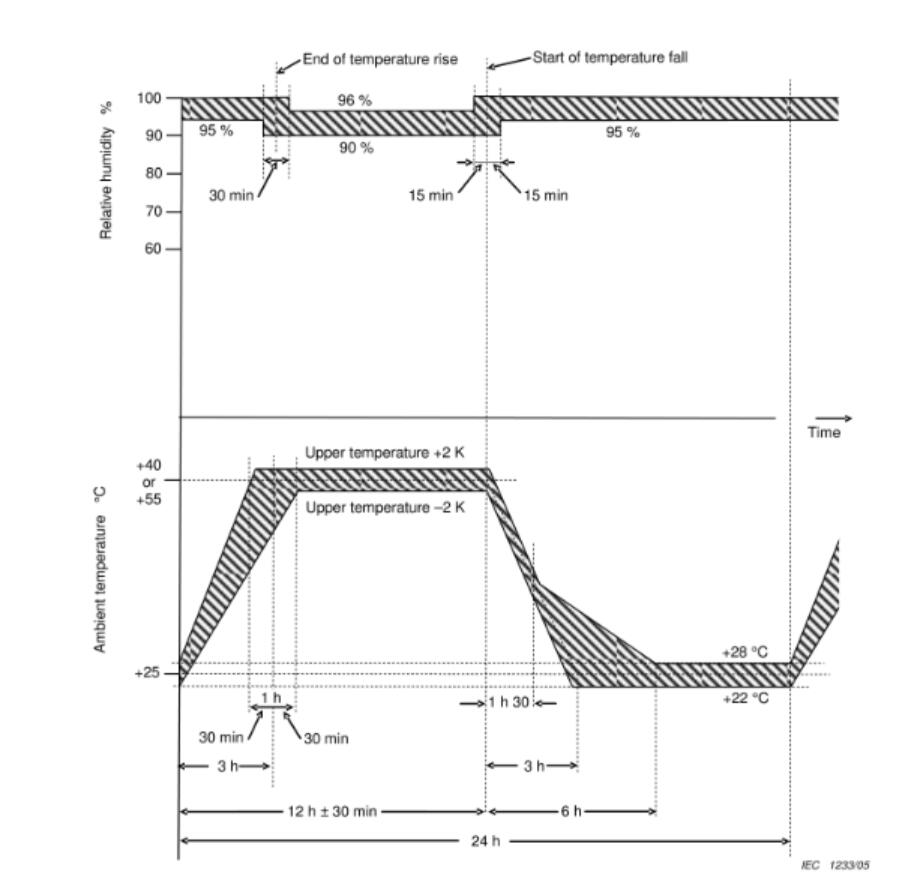
IEC 60068-3-5 defines the rate over the steep part of the heating or cooling curve, specifically between 10% and 90% of the full interval being traversed. The full heating and cooling intervals are recorded as well, but the standardised rate figure comes from that central segment. Measuring across the whole sweep, including the shoulders where the chamber is speeding up or slowing down, would understate the rate during the part of the ramp where control is actually hardest.
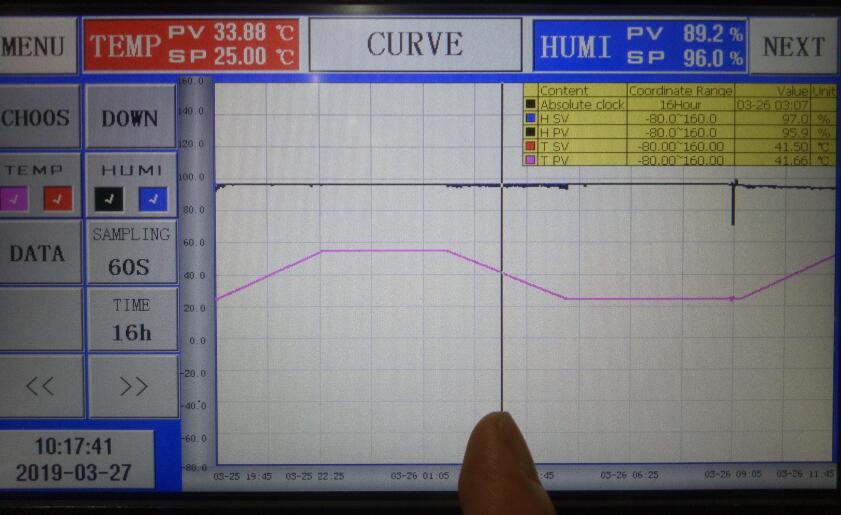
Two practical things affect the number you get. Sensor response time can smooth the curve, so a slow thermocouple or one sitting away from the moving air will read low. Sampling frequency matters too; readings taken at wide intervals can miss irregularities inside the ramp. Heating and cooling should be checked separately because the achievable rates in the two directions often differ. And a chamber that reaches its target within the stated total time can still overshoot or flatten somewhere in the middle, so the recorded curve is worth looking at for shape, not only for elapsed time.
Fluctuation, uniformity and ramp rate answer different questions, and none of them substitutes for the others. Fluctuation asks whether the chamber can hold a condition at a point. Uniformity asks whether it holds that condition everywhere that matters. Ramp rate asks whether it can move between conditions the way the test method assumes.
A verification record worth keeping will usually identify the sensors and their calibration status, state whether the chamber was empty or loaded, describe where the sensors sat, give the stabilisation criterion and recording duration, and name the calculation convention used for fluctuation and uniformity. Re-verification intervals depend on how the equipment is used and what is at stake. A common baseline is at least annually, with extra checks after major repair, sensor replacement, or any change in test conditions that could affect performance. A series of comparable records tells you more than a single pass or fail, because it shows drift rather than just a snapshot.
Once those three dimensions have been measured with a stated method, the chamber display becomes a useful indicator rather than something to take on faith.
The figures below are an example of how chamber specifications are typically presented. They are useful for orientation, but they describe catalogue capability rather than a verified result for a specific unit in a specific lab.
| Parameter | TH-80 | TH-150 | TH-225 | TH-408 | TH-800 | TH-1000 |
|---|---|---|---|---|---|---|
| Internal dimensions W×H×D (mm) | 400×500×400 | 500×600×500 | 600×750×500 | 600×850×800 | 1000×1000×800 | 1000×1000×1000 |
| External dimensions W×H×D (mm) | 950×1650×950 | 1050×1750×1050 | 1200×1900×1150 | 1200×1950×1350 | 1600×2000×1450 | 1600×2100×1450 |
| Approx. weight (kg) | 150 | 180 | 250 | 320 | 400 | 450 |
| Temperature range | Low: A 25 °C / B 0 °C / C −20 °C / D −40 °C / E −60 °C / F −70 °C. High: 150 °C, 180 °C or 200 °C. | |||||
| Humidity range | Optional: 20%–98% R.H. / 10%–98% R.H. / 5%–98% R.H. | |||||
| Display resolution / distribution uniformity | 0.1 °C; 0.1% R.H. / ±2.0 °C; ±3.0% R.H. | |||||
| Control accuracy (temperature / humidity) | ±0.5 °C; ±2.5% R.H. | |||||
| Temperature rising / falling rate | Rising approx. 0.1–3.0 °C/min; falling approx. 0.1–1.5 °C/min. Minimum falling rate of 1.5 °C per minute available as a special option. | |||||
| Material | Inner box: SUS 304 stainless steel. Outer box: stainless steel or cold-rolled steel with paint coating. Insulation: high-temperature-resistant, high-density foam. | |||||
| Cooling system | Air-cooled or water-cooled. Single-stage compressor for −40 °C; double-stage compressor for −70 °C. | |||||
| Protection devices | Fuse-free switch, compressor overload protection, high/low voltage refrigerant protection, over-humidity and over-temperature protection, fuses, fault warning system, low water level warning. | |||||
| Optional accessories | Inner door with operation hole, recorder, water purifier, dehumidifier. | |||||
| Compressor | French Tecumseh brand; Germany Bizer brand. | |||||
| Power supply | AC 220 V, 1-phase, 3-wire, 50/60 Hz; or AC 380 V, 3-phase, 5-wire, 50/60 Hz. | |||||
International Electrotechnical Commission. IEC 60068-3-5:2018, Environmental testing – Part 3-5: Supporting documentation and guidance – Confirmation of the performance of temperature chambers.
国家市场监督管理总局. JJF 1101-2019 环境试验设备温度、湿度参数校准规范 [Calibration Specification for Environmental Testing Equipment for Temperature and Humidity Parameters].
Physikalisch-Technische Bundesanstalt. Calibration capabilities for temperature chambers, including measuring-point arrangement consistent with DIN EN 60068-3-5 and a load corresponding to at least 40% of the useful volume.
BINDER GmbH. BINDER Factory Standard: Technical Data [PDF]. Definitions of temperature fluctuation and temperature uniformity (variation) based on DIN 12880:2007.

